Social Media Module: Dashboard and Findings
Note: This article describes the new Social Media dashboard. For information about the legacy Social Media dashboard, see this article instead.
Dashboard Summary
Use the Social Media dashboard to review threat detection and mitigation activity across social media platforms, based on your organization’s search terms, for a selected time period. You and your security team can quickly understand the scale and characteristics of detected threats on those platforms.
The selected time period is displayed as a date range in the upper right of the dashboard. The default time period is the previous 12 months. To change this, click the date range and specify a different time period.
The Social Media dashboard contains three sections, or views:
- Detection Overview – Comprehensive view of detection activities for your brand
- Takedown Activity – Status and metrics for mitigation and takedown actions, including median takedown time by platform
- Executive Impersonations – Impersonation threats targeting monitored executives
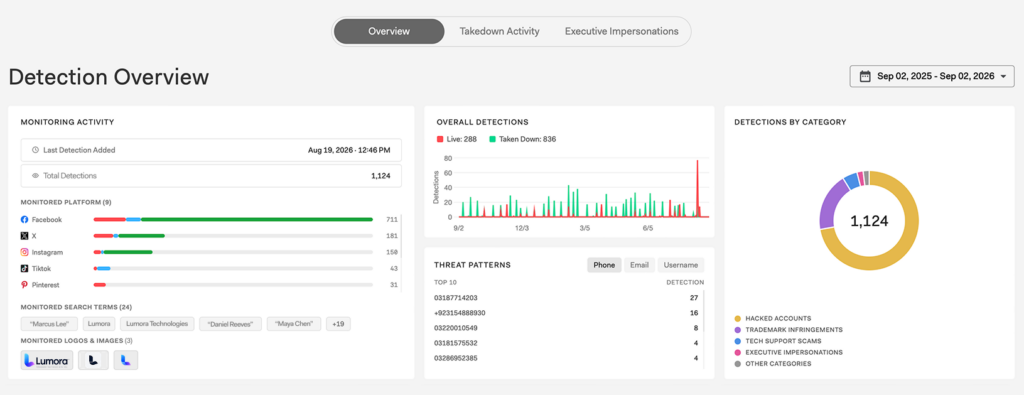
Monitoring Activity
he Monitoring Activity widget provides a snapshot of the Bolster’s social media monitoring activity for your organization during the selected time period, including:
- Last Detection Added – Timestamp of the most recent threat detection on a monitored platform. This is independent of the dashboard’s selected time period.
- Total URLs Scanned – Number of social media URLs scanned during the selected time period.
- Monitored Platforms – Which platforms Bolster scans for threats, and how many threats have been found on each.
- Monitored Search Terms – Which search terms (set up by your organization) Bolster uses to identify content to scan, and how many threats have been found for each.
- Monitored Logos and Images – Which visual Assets Bolster looks for, and how many of each have been detected.
Overall Detections
The Overall Detections widget visualizes detection activity over time, allowing you to identify spikes in fraudulent activity and compare newly detected threats with completed takedowns. It displays counts of live threats detected and threats taken down on a specific date, as well as total counts of live and taken-down detections for the time period.
Threat Patterns
The Threat Patterns widget lists the top 10 most frequently detected phone numbers, email addresses, and usernames associated with threats detected during the dashboard’s selected time period, helping identify recurring attacker patterns.
Detections by Category
The Detections by Category widget shows the relative volume of total detections for different categories during the dashboard’s selected time period, making it easy to understand which types of abuse most frequently target your organization.
Detection Lifecycle
The Detection Lifecycle widget displays findings generated from your monitored search terms and shows how they progress through the threat lifecycle. Findings from all search terms are grouped into one of four stages: Live Detections, Takedown in Progress, Taken Down, or Ignored. This view helps you understand the volume of findings at each stage and track how detections move from initial discovery through mitigation.
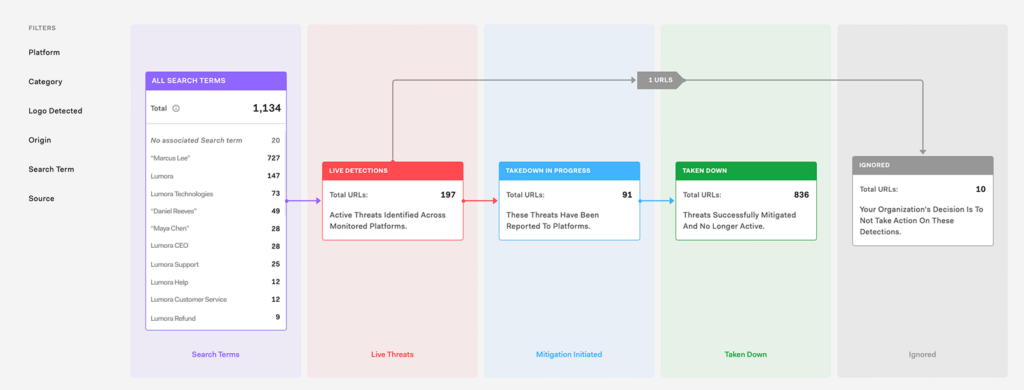
The detailed flow chart shows counts of the following:
- All Search Terms – Total threat detections across the listed search terms.
- Live Detections – Active threats identified across monitored platforms.
- Takedown in Progress – All URLs that SOC has or will report to platforms.
- Taken Down – Threats successfully mitigated and no longer active.
- Ignored – Threats on which your organization has decided not to take action. A finding can be marked ignored on its Insights page.
You can filter the data in the flow chart by one or more of the following:
- Platform – Specific social media service the threat was found on (Facebook, TikTok, etc.)
- Category – Type of threat detected (Executive Impersonation, Trademark Infringement, etc.).
- Logo Detected – Whether the content included a logo cataloged as an Asset
- Origin – Type of content in which the threat was found (post, profile, etc.)
- Search Term – Specific search term that was being monitored and resulted in the detection
- Source – Who found the URL (Bolster, or your team)
Click on a stage to see a list view of all the URLs in that stage.
Takedown Activity
In addition to the Overview, the Social Media dashboard has a dedicated, comprehensive Takedown Activity view that shows how threats are being mitigated across social media platforms. To switch to this view, select Takedown Activity at the top of the screen.
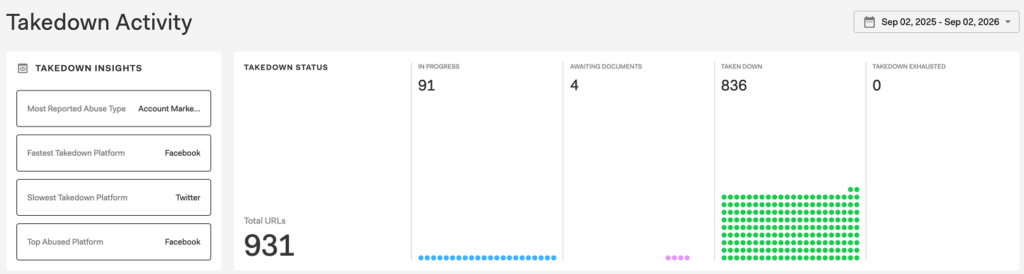
Use the Takedown Activity view to track takedown progress, measure response efficiency, and identify patterns across platforms and threat types. It answers key questions about threat mitigation, such as:
- How many threats are currently being mitigated?
- How long does it take to take down social media threats?
- Which platforms are most involved in takedowns?
- Where are bottlenecks in the takedown process?
Takedown Insights
The Takedown Insights widget provides key performance and trend indicators to help evaluate mitigation effectiveness.
Metrics include:
- Most Reported Abuse Type – Most common category of abuse (e.g., phishing)
- Fastest Takedown Platform – Platform with the quickest average takedown time
- Slowest Takedown Platform – Platform with the longest takedown time
- Top Abused Platform – Platform most frequently associated with detected threats
Use the Takedown Insights widget to identify operational efficiency and external dependencies affecting takedown performance.
Takedown Status
The Takedown Status widget summarizes the current state of all social media URLs in the mitigation pipeline. Possible states include:
- In Progress – Actively undergoing takedown actions.
- Awaiting Documents – Takedown is pending required documentation or approvals.
- Taken Down – Successfully mitigated threats that are no longer active.
- Takedown Exhausted – All mitigation attempts have been completed without success.
Takedown Activity Matrix
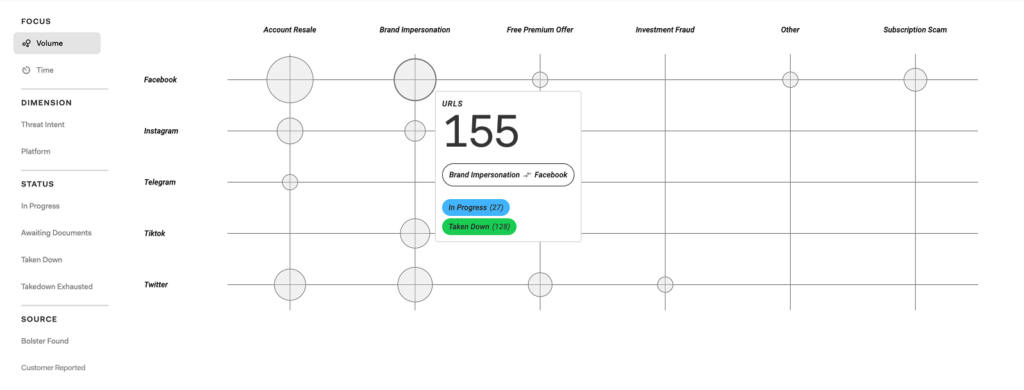
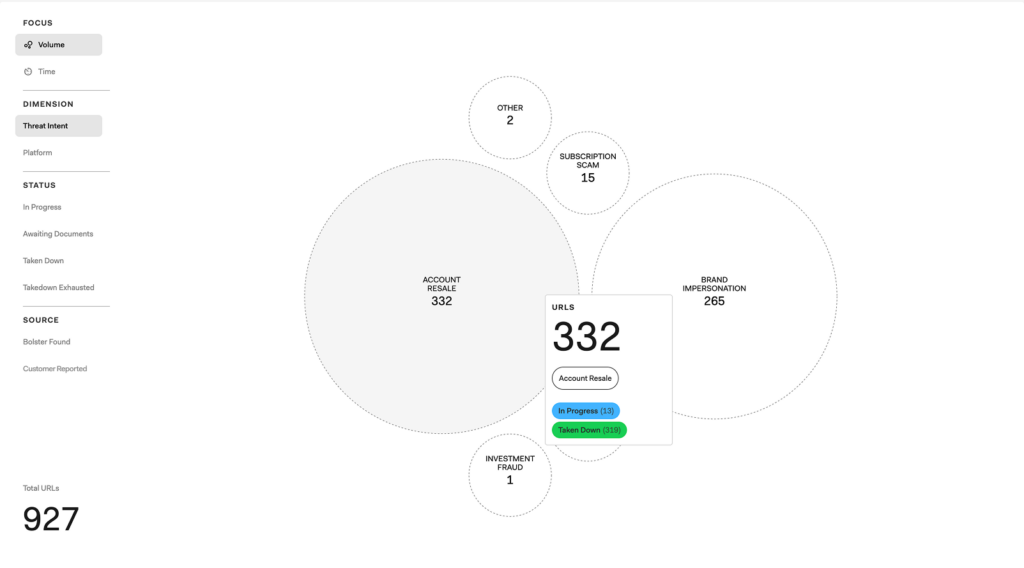
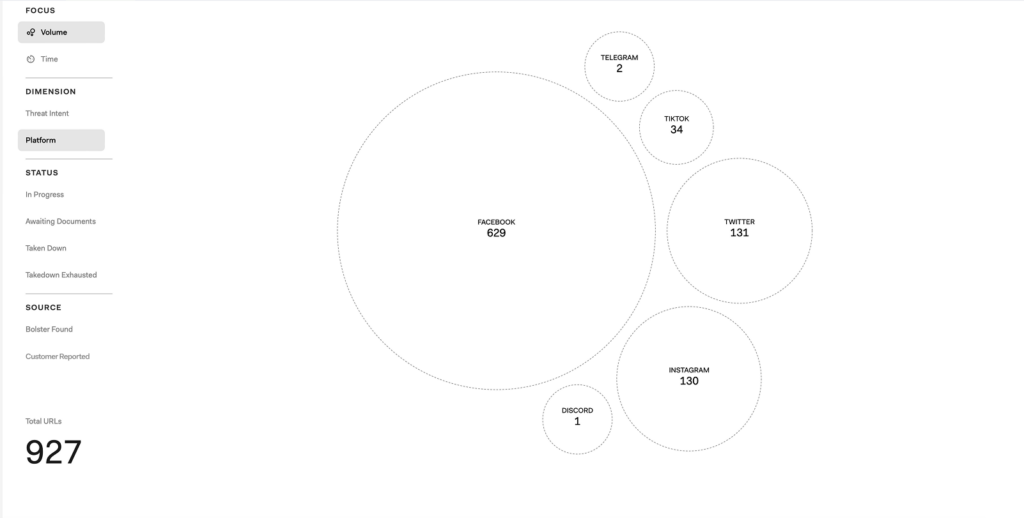
The main visualization is an interactive matrix (bubble chart) that shows how takedown activity is distributed across different dimensions.
Here’s how the matrix is organized:
- Rows (Y-axis) – Social media platforms associated with the URLs
- Columns (X-axis) – Threat categories including:
- Account Resale
- Brand Impersonation
- Free Premium Offer
- Investment Fraud
- Subscription Scam
- Circles (bubbles) – Each circle represents a group of URLs
- Circle size – Indicates the volume of URLs within that category
The left side control panel provides filters and other options to refine the analysis. These include:
- Focus controls
- Volume – Displays the number of URLs (default view)
- Time – Switches the visualization to focus on time-based metrics (e.g., takedown duration)
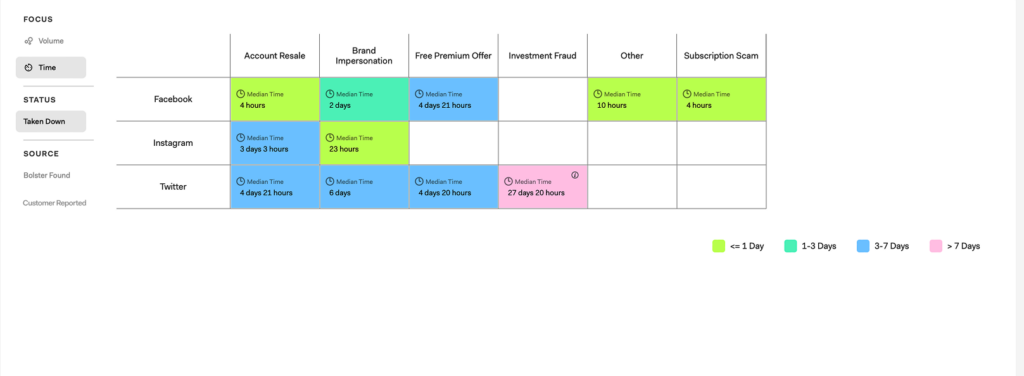
- Volume – Displays the number of URLs (default view)
- Dimension filters
- Threat Intent – Filters by category of threat (e.g., account resale, brand impersonation, etc.
- Platform – Filters by social media platform associated with the URL
- Threat Intent – Filters by category of threat (e.g., account resale, brand impersonation, etc.
- Status filters for URL takedown status:
- In Progress
- Awaiting Documents
- Taken Down
- Takedown Exhausted
- Source filter
- Bolster Found – URLs detected by Bolster’s scanning system
- [Brand] Reported – URLs submitted by your team
Use the Takedown Activity view to:
- Monitor real-time takedown progress
- Identify delays or bottlenecks in mitigation
- Understand which platforms require escalation
- Prioritize high-impact threats based on volume
- Track overall takedown efficiency over time
Executive Impersonations
The third dashboard view, Executive Impersonations, focuses on threats based on specific employees that your organization has cataloged as Assets.
For more, see Social Media Executive Impersonations.
Detailed Findings
While the Social Media dashboard is a snapshot of Bolster’s social media defense activities for a selected time period, you can use the left navigation bar to access table list views of all findings and drill into individual threats.
These views are organized across four stages of the threat lifecycle:
- Live Detections – Findings that are still live
- Takedown in Progress – Findings where Bolster has initiated takedown
- Taken Down – Findings that have been taken down
- Ignored – Findings that your team has analyzed, decided not to act upon, and marked as ignored
Add Search Terms
Click Add Search Terms to review and manage the search terms Bolster monitors for social media threats. Add search terms whenever you want Bolster to scan for something new, such as a new executive at risk of impersonation.
For more, see Using Social Media Search Terms.