Integrating Microsoft Sentinel
This guide has two parts
- Part 1 – Send Bolster findings to your Logic App (original setup): create the Logic App and connect it to the Bolster platform.
- Part 2 – Store the findings in Microsoft Sentinel (new – added Oct 2026): forward the data from the Logic App into a Sentinel table using the Logs Ingestion API. Required because Microsoft retired the HTTP Data Collector API on 14 Sep 2026.
Part 1 – Send Bolster findings to your Logic App
Microsoft Sentinel is a cloud-native security management solution running in the Microsoft
cloud. You can integrate Microsoft Sentinel with the Bolster Platform with webhooks.
Prerequisites
Ensure you have all required accounts and utilities before starting the integration:
- A Microsoft subscription
- Access to the Microsoft Portal
- A Log Analytics workspace
Create Log Analytics Workspace
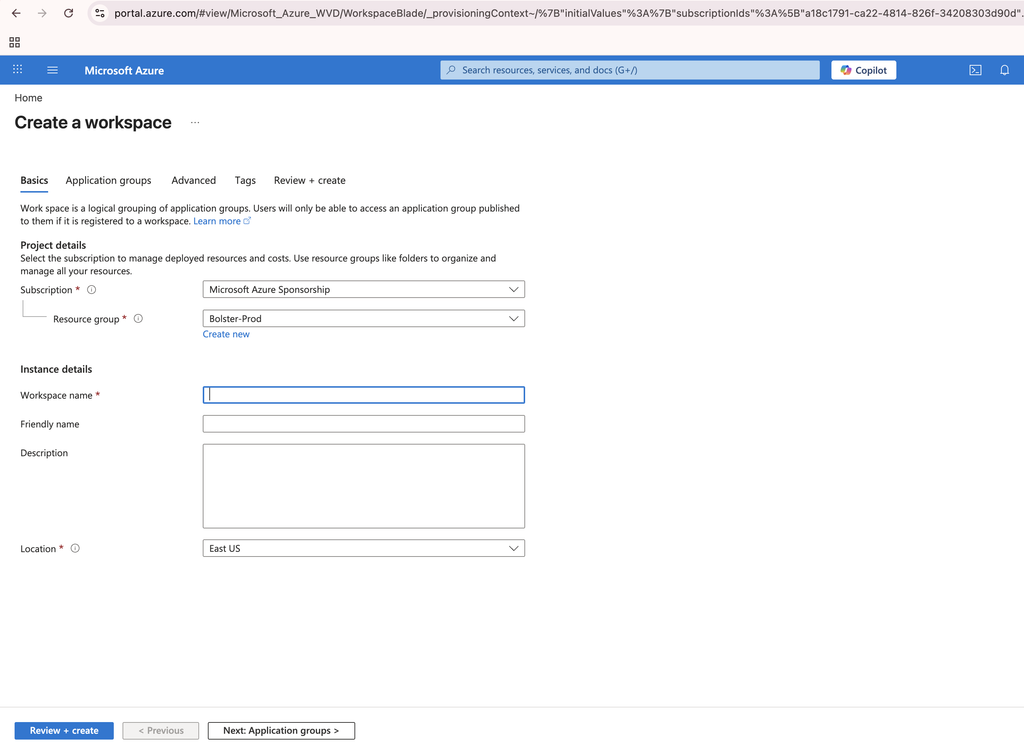
- In the Microsoft portal, create your workspace
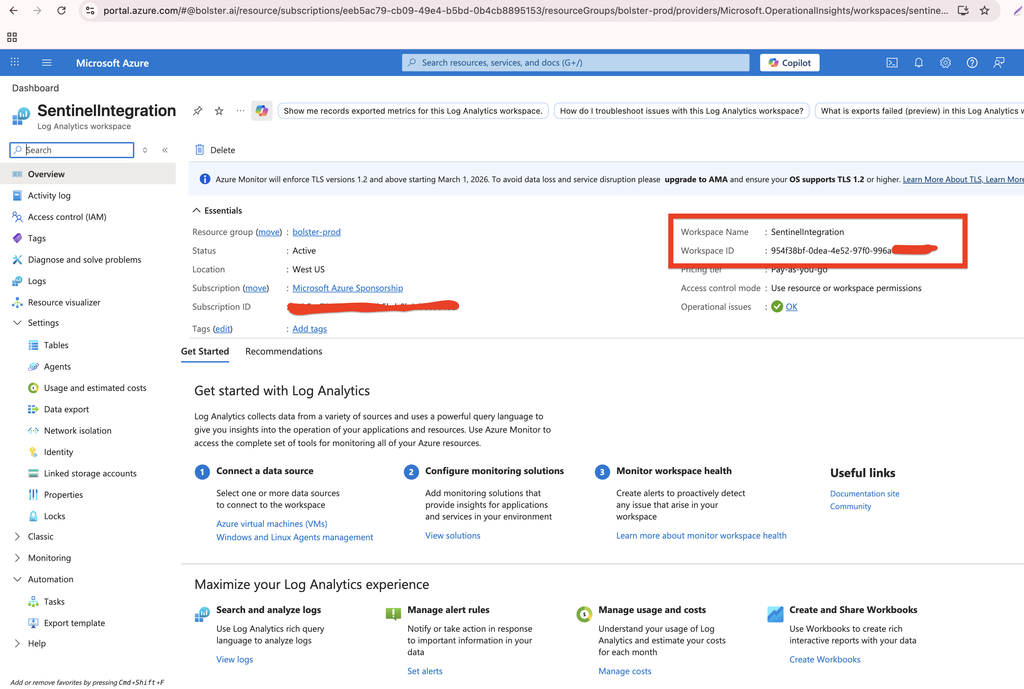
- Open your workspace, click Overview
- Copy Workspace Id
Configuring Microsoft Sentinel
Microsoft Sentinel configuration requires creating a Logic app and setting up Microsoft Log Analytics.
Creating a Logic App in Microsoft
- Log in to the Microsoft dashboard.
- Search for the "Logic App" and select it.
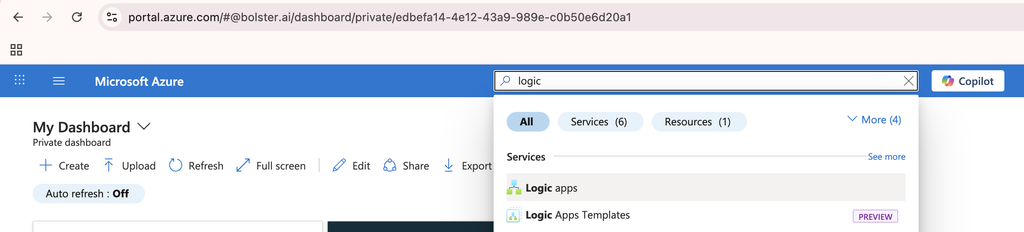
- Click Create.
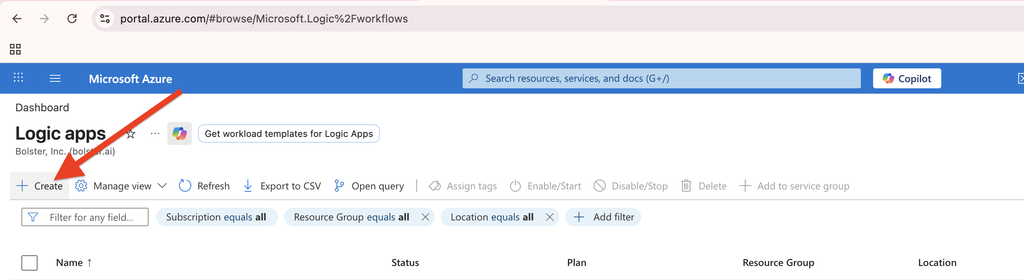
- Select hosting option plan based on your requirement
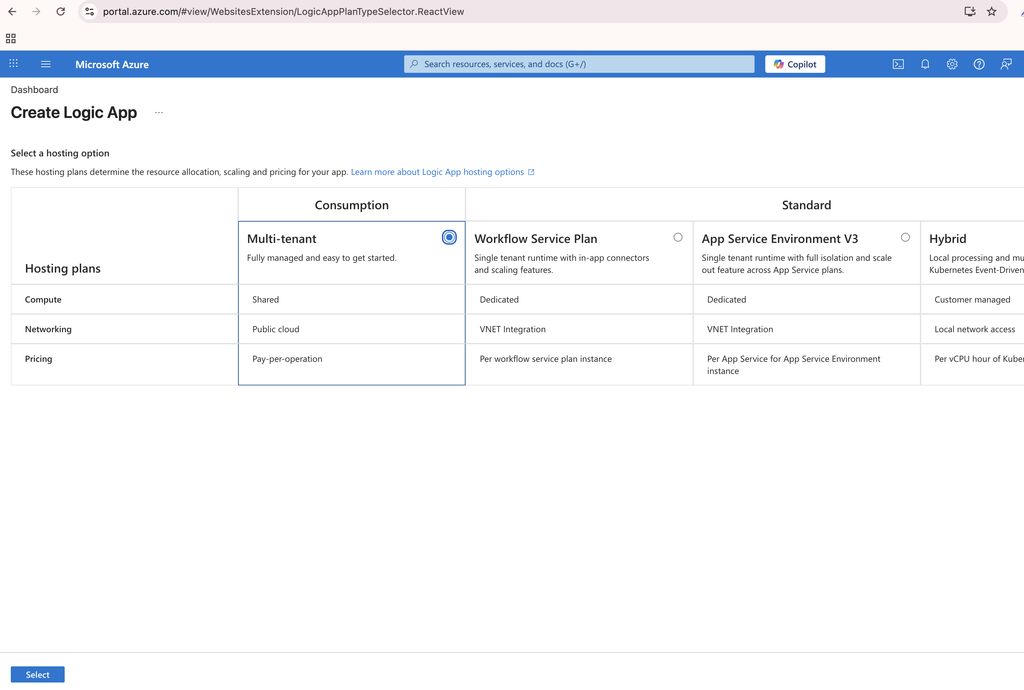
- Fill in the required information for your Logic App and click Review+Create.
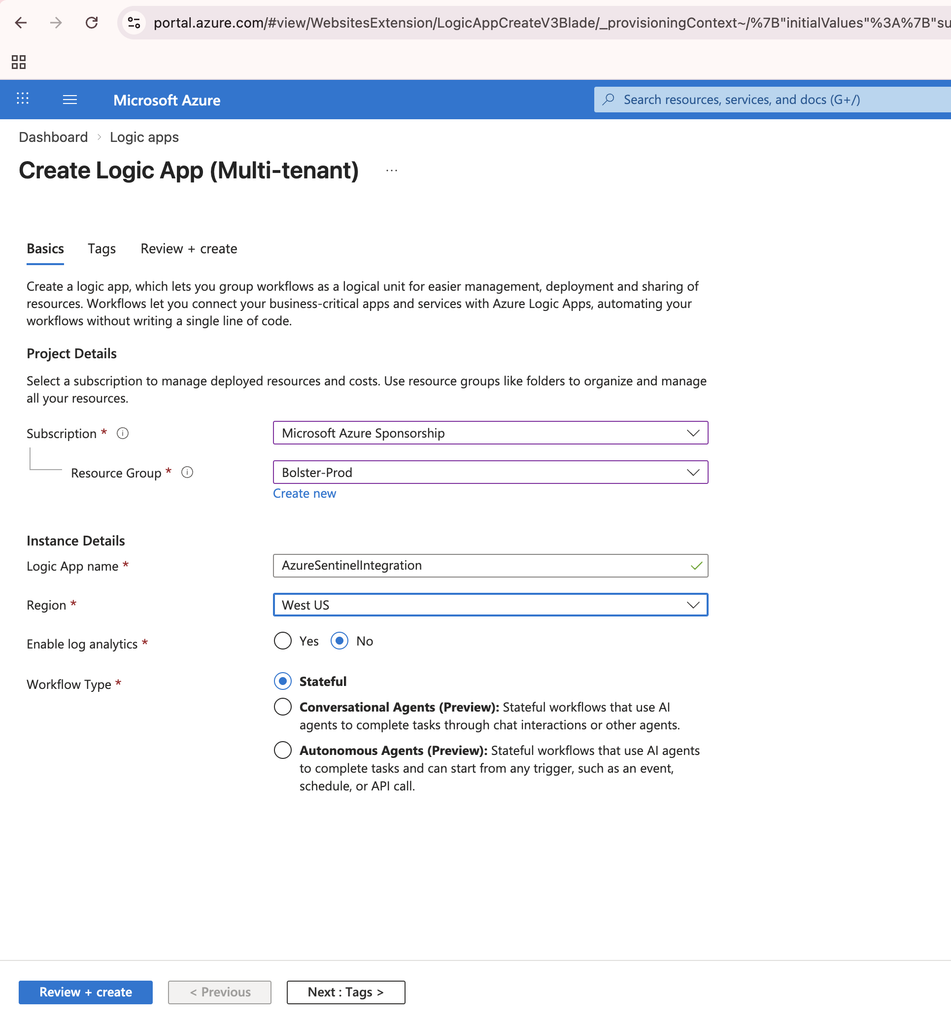
Once the deployment is done, your Logic App is created in Microsoft.
Setting up Microsoft Log Analytics
- Open the created logic app
- Click Logic App Designer under the "Development Tools" section in the Logic App.
- In the designer, click Add trigger.
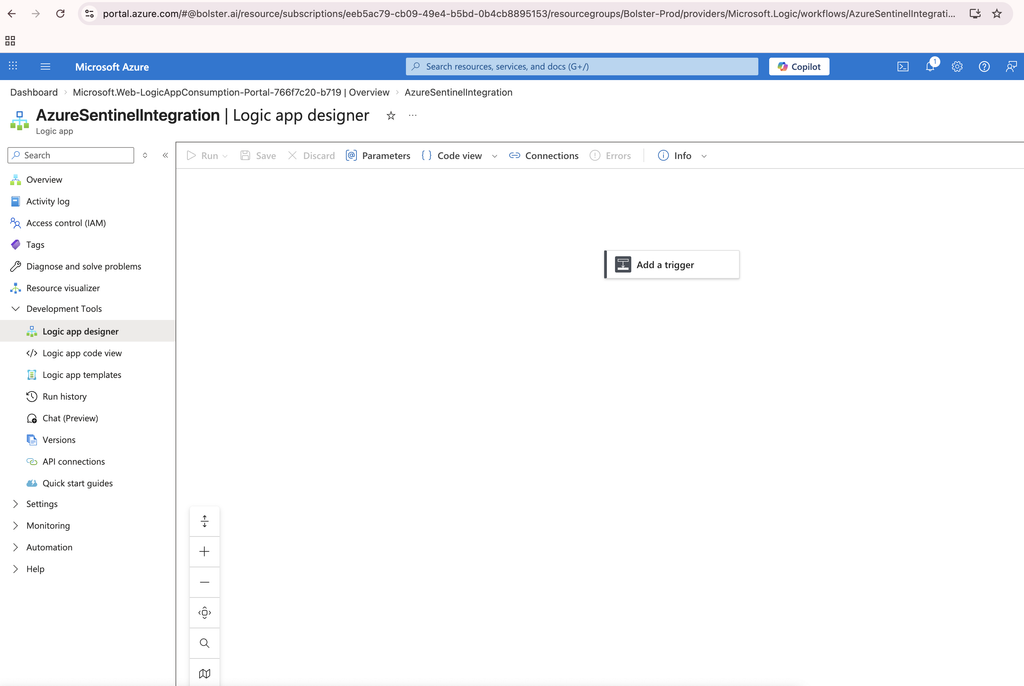
- In the Add trigger window, search for "HTTP" and select "When an HTTP request is received." You will use this trigger when setting up a connection with your custom application via api
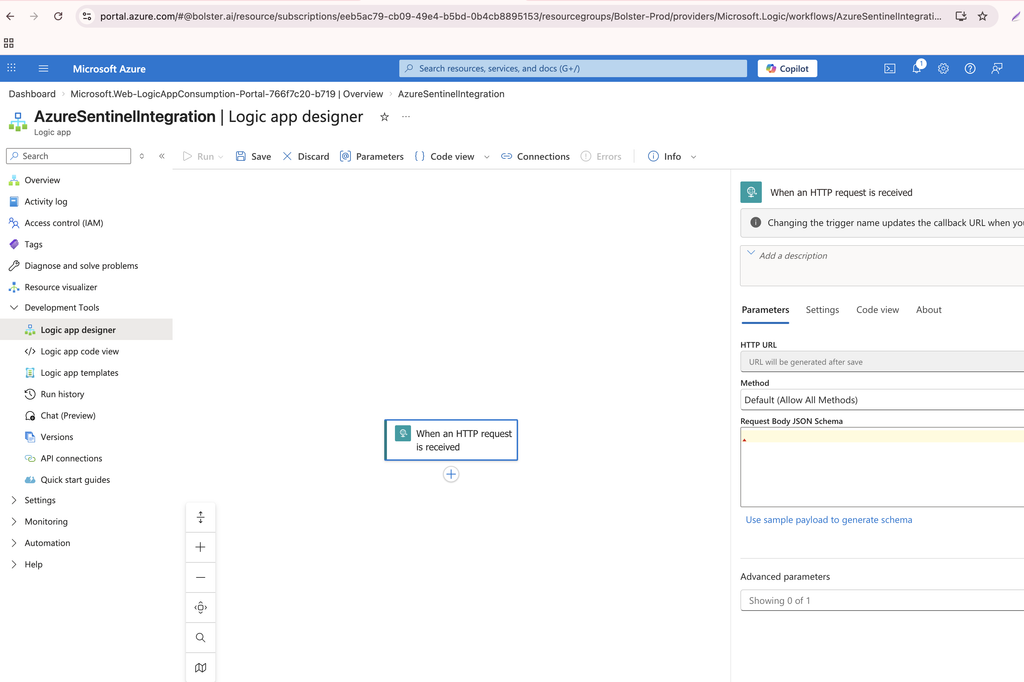
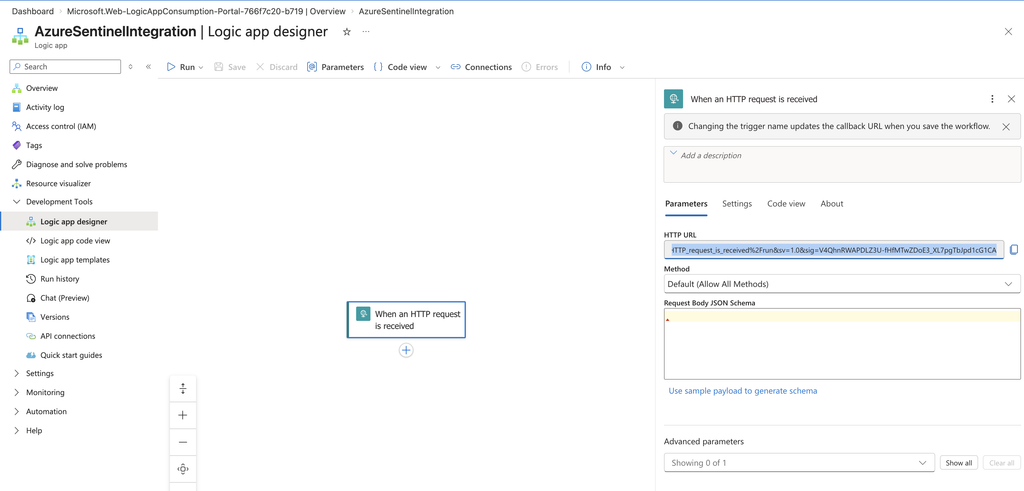
- Save it and copy the HTTP URL
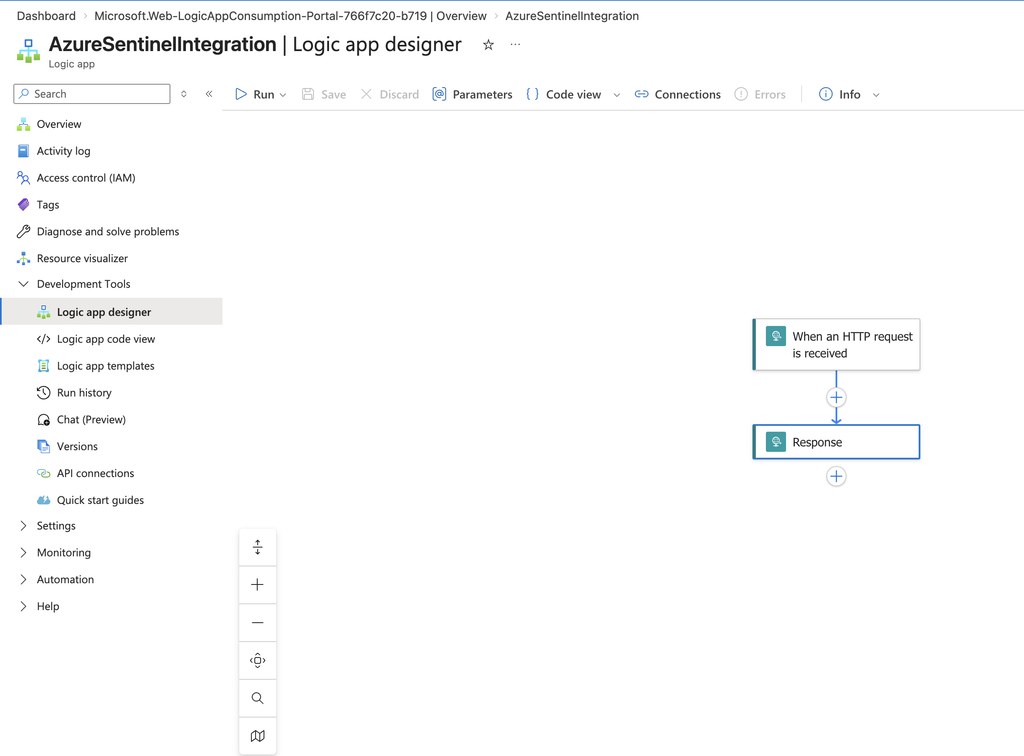
- You can add multiple triggers according to your requirements.
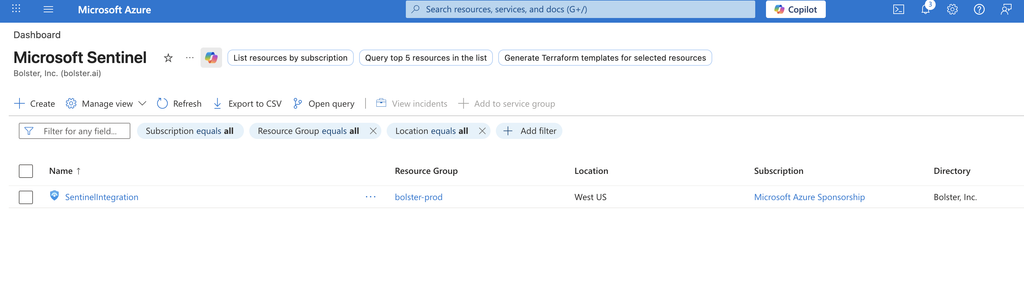
Add Microsoft Sentinel to your workspace
- Go to Microsoft Sentinel and click on create
- Choose/create your workspace to add
Conclusion
Following these steps, you will be able to set up a trigger for Microsoft Sentinel. Ensure that you store the trigger URL securely as it is required for integration.
In the Platform ( Bolster Platform):
- Login to the Platform:
Log in to the platform . - Go to Integrations:
Click on the Integration tab, Go to Microsoft Sentinel.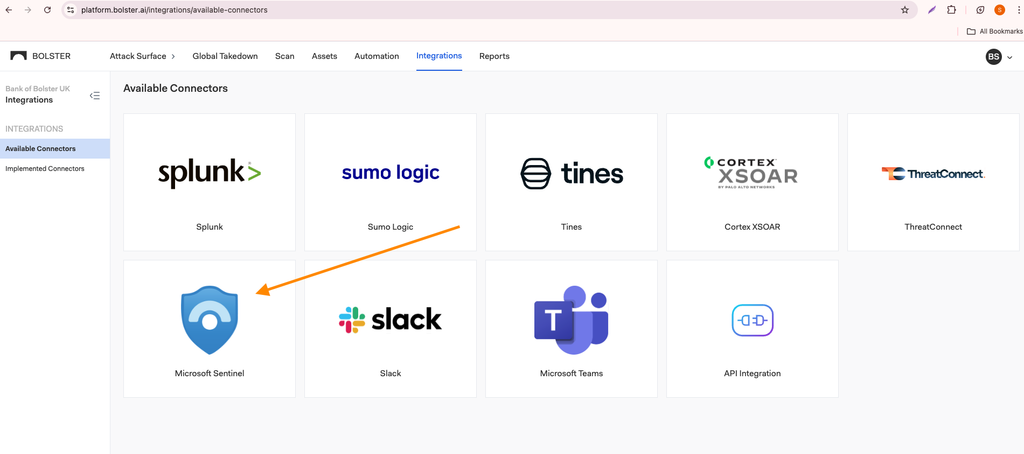
- Create New Connector:
In the Microsoft Sentinel Connector , provide a name for the connector. - Input logic app http URL
- Input the Connector Name
- In the URL field, paste the URL you copied from the HTTP request setup.
- Test and Save Connector:
- Click on Test Connector to ensure everything is set up correctly.
- Once the test is successful, click Save.
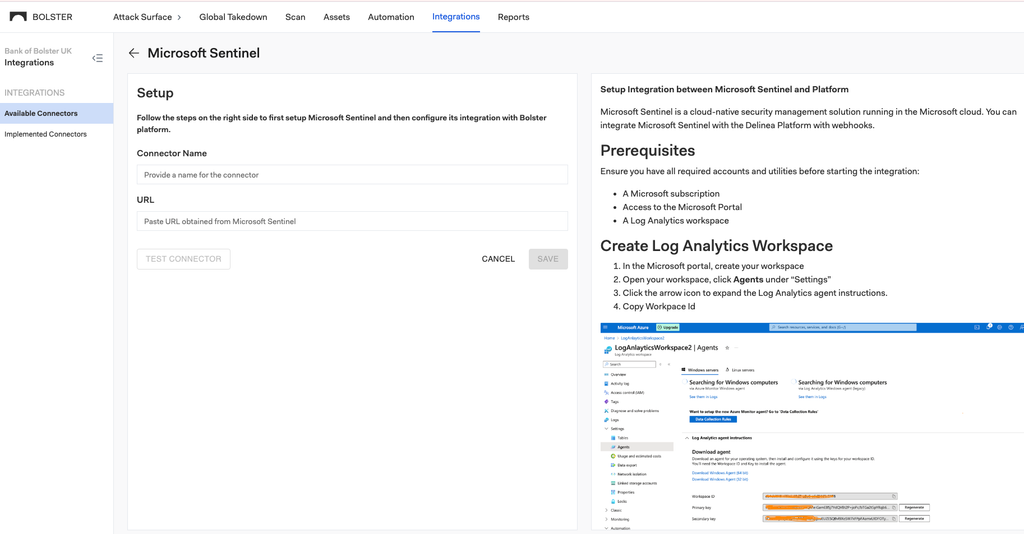
By following these steps, you can successfully set up a connection to send data from your platform to Microsoft Sentinel. This integration allows for automated data transfers and notifications directly within your Microsoft Sentinel environment.
Verify the data from platform in Microsoft Sentinel
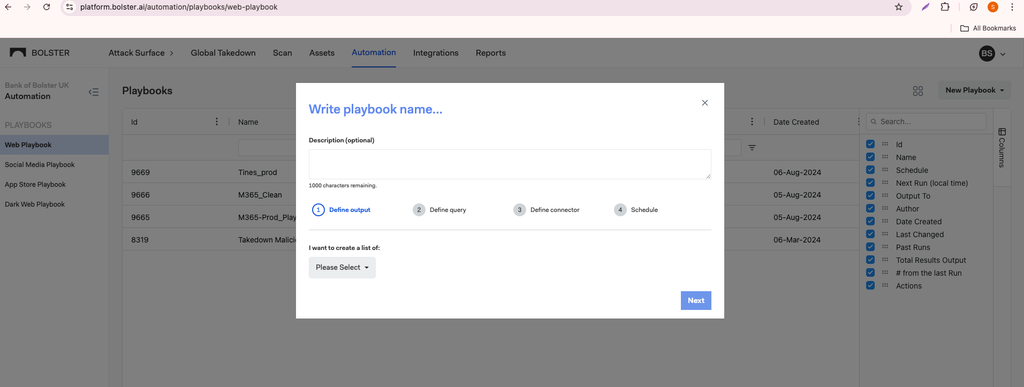
- Create an automation playbook in the platform by clicking on “NEW PLAYBOOK“
- Provide all the necessary details in the form
- In define connectors in the form
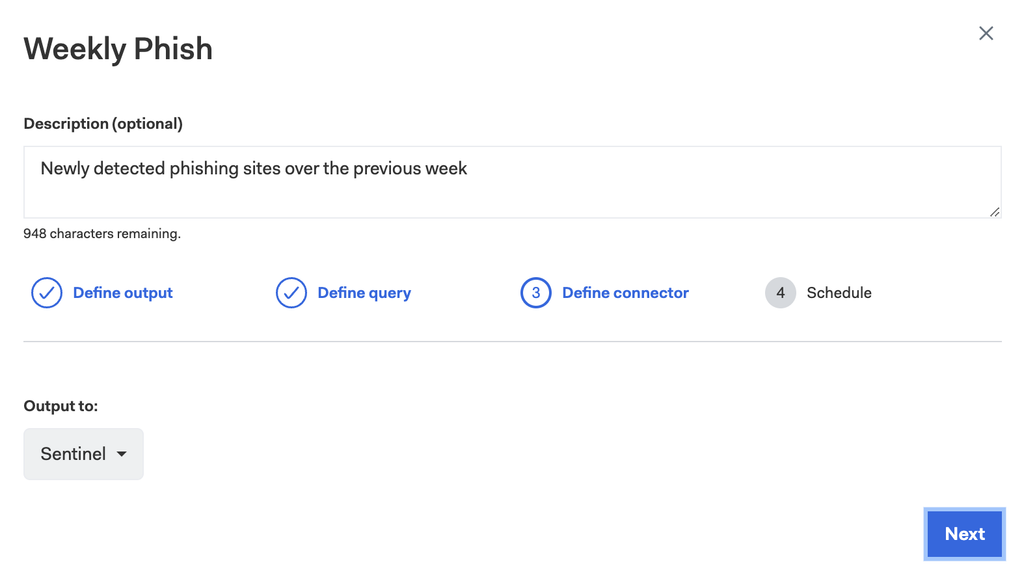
- In define connectors, choose above created connector
- Run the playbook
- Observe the result in the sentinel
Part 2 – Store the findings in Microsoft Sentinel (Logs Ingestion API)
Why this section was added
The steps above deliver Bolster findings to your Logic App. To also store them in a Microsoft Sentinel table, extend the Logic App as described below. Microsoft retired the legacy HTTP Data Collector API (the Logic App Send Data action) on 14 Sep 2026; the Logs Ingestion API is the supported replacement. Nothing changes in the Bolster platform.
Required permissions
The person doing the setup needs these Azure roles on the resource group (or Contributor + User Access Administrator, which covers all of them). Reader alone cannot create anything.
| Role | Needed for | Step |
| Monitoring Contributor | Create the Data Collection Endpoint and Data Collection Rule | A, B |
| Log Analytics Contributor | Create the custom table in the workspace | B |
| Logic App Contributor | Enable the Logic App identity and edit the workflow | C, E |
| Role Based Access Control Administrator (can be limited to assigning Monitoring Metrics Publisher) – or User Access Administrator / Owner | Give the Logic App permission on the Data Collection Rule | D |
The Logic App itself (its managed identity) needs one role: Monitoring Metrics Publisher on the Data Collection Rule.
Before you start
- Create every resource in the same region as the Log Analytics workspace.
- Use different names for the Data Collection Endpoint and the Data Collection Rule (e.g. bolster-dce and bolster-dcr) – same names make it easy to assign the role in Step D to the wrong resource.
- Your organization may require tags (e.g. Environment) on new resources.
Step A – Create a Data Collection Endpoint (DCE)
- In the Azure portal search for Data collection endpoints > + Create.
- Enter a name (e.g. bolster-dce), subscription and resource group.
- Region: select the workspace region (the form defaults to East US).
- Review + create > Create.
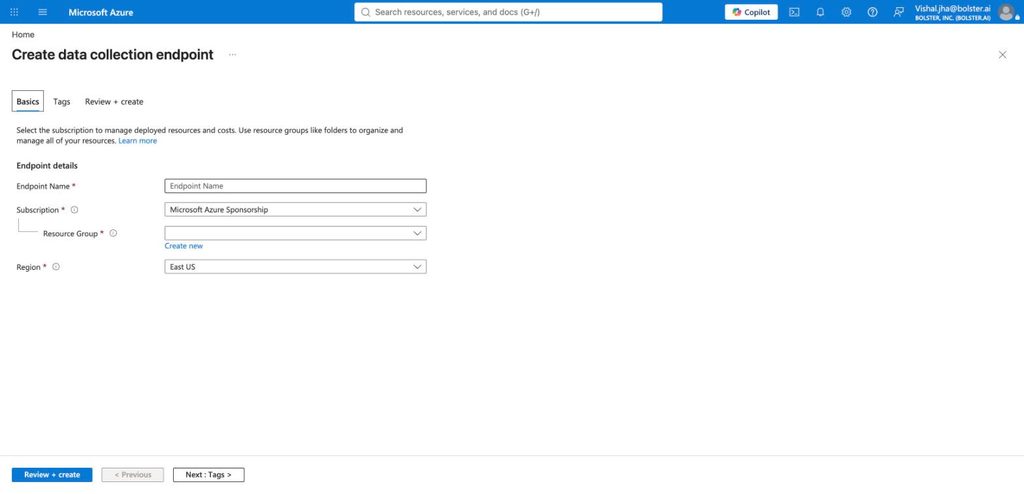 Create data collection endpoint – change Region from the default East US to the workspace region
- Open the endpoint and copy the Logs Ingestion URI.
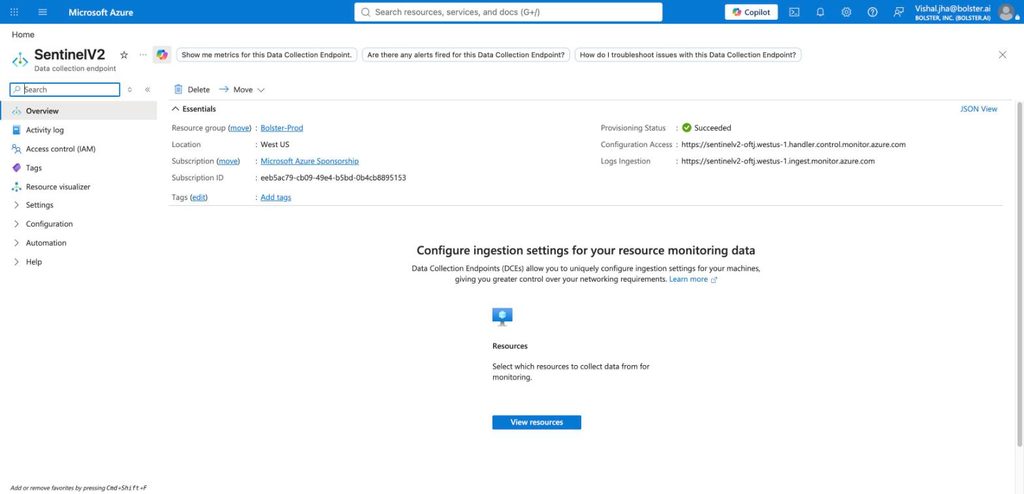 Endpoint overview – copy the Logs Ingestion URI
Step B – Create the custom table and Data Collection Rule (DCR)
- Open the workspace > Settings > Tables > + Create > New custom log (DCR-based).
- Table name: e.g. BolsterFindings (Azure adds _CL). Table plan: Analytics – required so the data can be used in Sentinel analytics rules and alerts.
- Data collection rule: Create a new data collection rule (e.g. bolster-dcr). Data collection endpoint: the endpoint from Step A. Click Next.
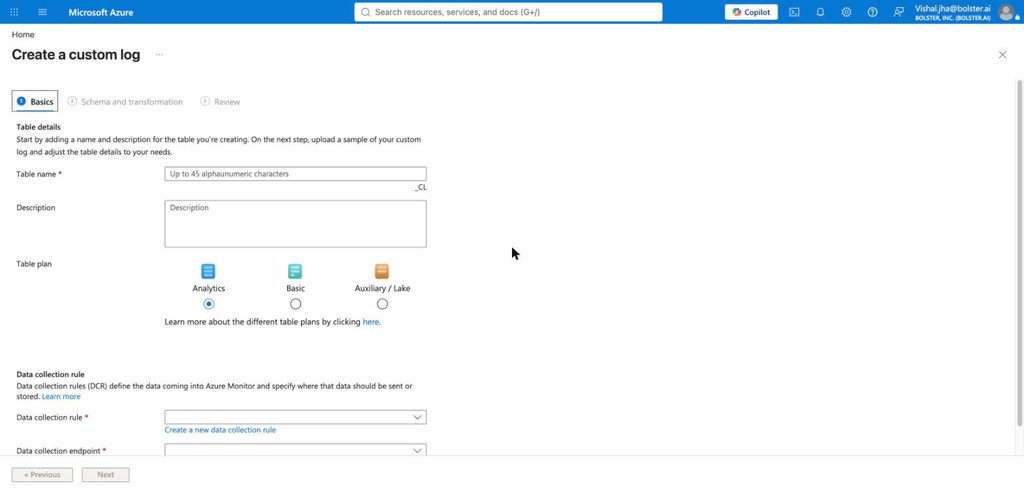 New custom log – Basics: table name, Analytics plan, rule and endpoint
- Upload sample file: use the sample below. Bolster sends # Customer Scans and # Bolster Scans, which Azure rejects as column names, so the sample uses CustomerScans and BolsterScans (the Logic App renames them in Step E).
- The wizard shows "TimeGenerated field is not found" and Next stays disabled – this is expected. Open Transformation editor, paste the transformation below, Run, Apply, then Next > Create.
Sample file (save as bolster-sentinel-sample.json)[
{
"Redirected URL": "https://login-example-test.com/showLogin.cc",
"Takedown Submission Timestamp": "2025-07-11T07:44:21.733Z",
"Status": "",
"Original Disposition": "suspicious",
"Brand ID": "examplebrand",
"Last Scanned": "2025-10-16T08:22:40.149Z",
"First Seen": "2025-07-06T12:58:50.057Z",
"Hosting Provider": "Example Hosting LLC",
"Scan Source": "Bolster",
"TLD": "com",
"Country": "US",
"Logo Detected": false,
"CustomerScans": 0,
"BolsterScans": 3,
"Takedown Time": "",
"IP Address": "192.0.2.10",
"Past Phish on IP": "",
"Past Phish on Host": "",
"Current Disposition": "suspicious",
"Disposition Change": "2025-07-06T12:58:50.057Z",
"Registration Date": "",
"Registrar": "",
"Category": "unknown",
"Insights URL": "https://platform.bolster.ai/web/insights/0000000000000/sample",
"Domain Name": "login-example-test.com",
"Last Updated": "2025-07-06T12:58:50.057Z",
"Source URL": "https://login-example-test.com/showLogin.cc",
"Risk": "",
"Registrant": "",
"MX Records": false,
"Nameservers": "",
"SFB Detected": false,
"Takedown Request Date": "2025-07-29T07:13:29.309Z",
"Takedown Requester Email": "",
"Tags": [],
"Scan Source Category": "Anti-Virus",
"Redirect Present": true
}
]
Transformation (adds TimeGenerated and renames fields with spaces to valid column names):source
| extend TimeGenerated = now()
| project-rename
RedirectedURL = ['Redirected URL'],
TakedownSubmissionTimestamp = ['Takedown Submission Timestamp'],
OriginalDisposition = ['Original Disposition'],
BrandID = ['Brand ID'],
LastScanned = ['Last Scanned'],
FirstSeen = ['First Seen'],
HostingProvider = ['Hosting Provider'],
ScanSource = ['Scan Source'],
LogoDetected = ['Logo Detected'],
TakedownTime = ['Takedown Time'],
IPAddress = ['IP Address'],
PastPhishOnIP = ['Past Phish on IP'],
PastPhishOnHost = ['Past Phish on Host'],
CurrentDisposition = ['Current Disposition'],
DispositionChange = ['Disposition Change'],
RegistrationDate = ['Registration Date'],
InsightsURL = ['Insights URL'],
DomainName = ['Domain Name'],
LastUpdated = ['Last Updated'],
SourceURL = ['Source URL'],
MXRecords = ['MX Records'],
SFBDetected = ['SFB Detected'],
TakedownRequestDate = ['Takedown Request Date'],
TakedownRequesterEmail = ['Takedown Requester Email'],
ScanSourceCategory = ['Scan Source Category'],
RedirectPresent = ['Redirect Present'] - Check the table under Settings > Tables (filter by name): Type Custom table, Plan Analytics.
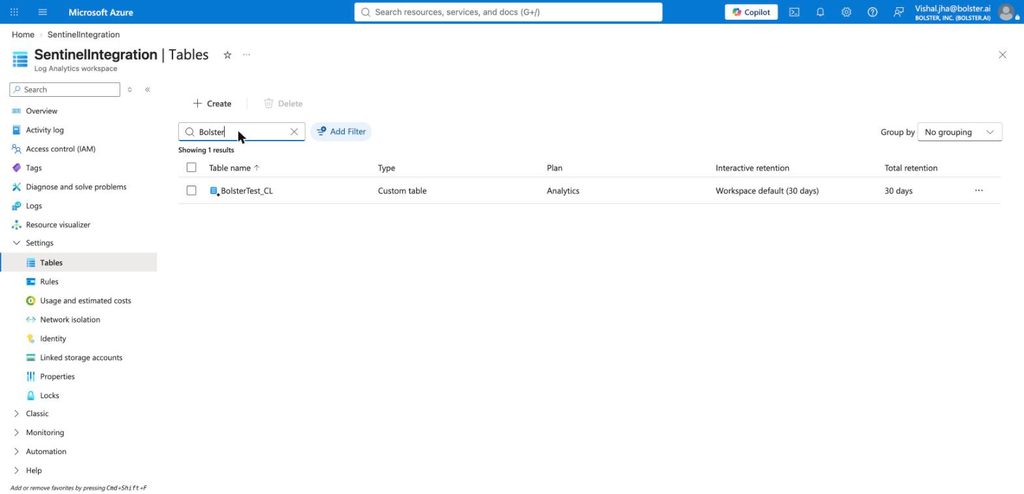 The new custom table
- Open Monitor > Data Collection Rules > your rule and copy the Immutable ID – it starts with dcr-. (The endpoint also has an ID starting with dce-; that one will not work.) The stream name is Custom-<TableName>_CL.
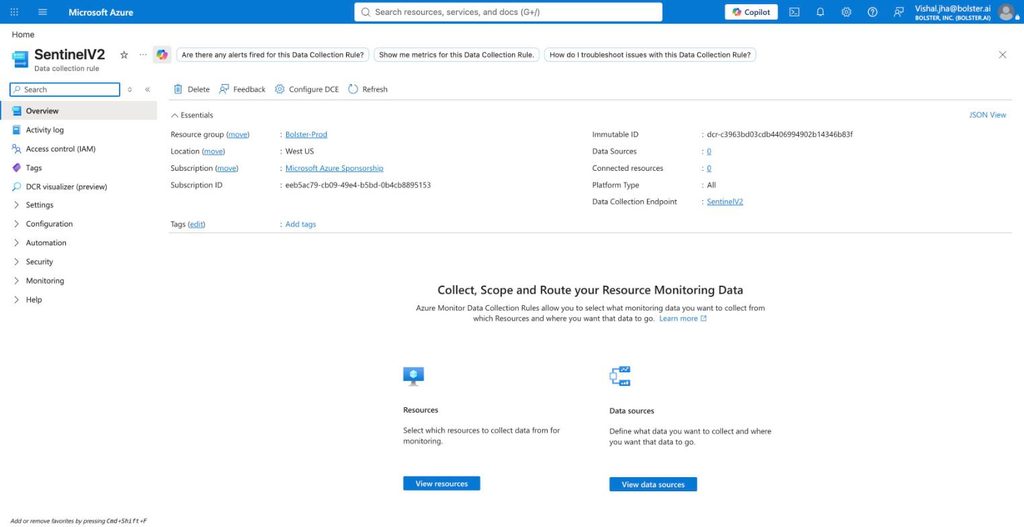 Data collection rule overview – Immutable ID (dcr-…)
Use now() for TimeGenerated: dsdfsdfsdf Bolster timestamps such as Last Scanned can be years old.
Step C – Enable the Logic App identity
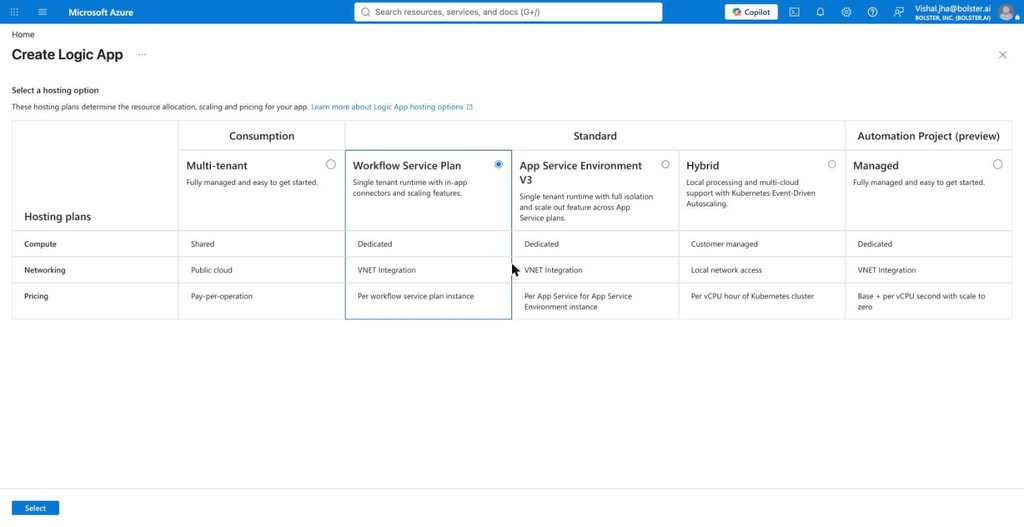
Use the Logic App created in Creating a Logic App in Microsoft above. If you create a new one, choose hosting option Consumption – Multi-tenant (the page pre-selects Workflow Service Plan, which has a running cost) and the workspace region.
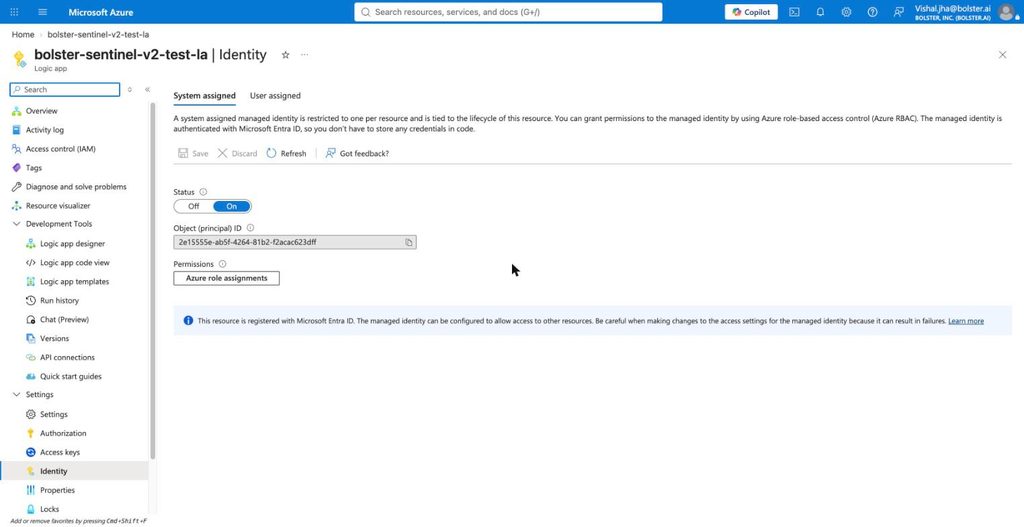
- Open the Logic App > Settings > Identity.
- System assigned Status: On > Save > Yes. An Object (principal) ID appears.
Step D – Give the Logic App permission on the Data Collection Rule
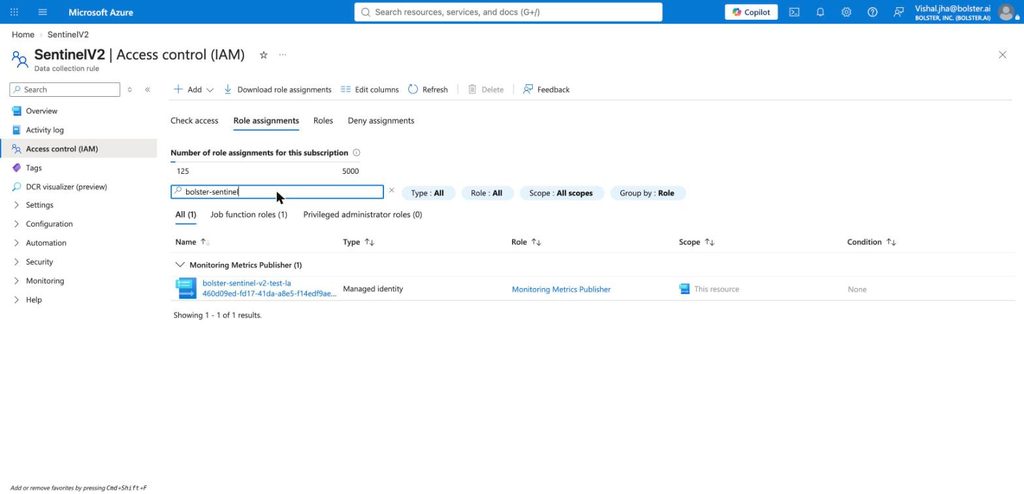
- Open Monitor > Data Collection Rules > your rule. Check the page subtitle says Data collection rule and the URL contains dataCollectionRules.
- Access control (IAM) > + Add > Add role assignment.
- Role: Monitoring Metrics Publisher > Next.
- Assign access to: Managed identity > + Select members > Managed identity: Logic app > select your Logic App > Select.
- Review + assign, then check the Role assignments tab. It can take up to 10 minutes to apply.
Common mistake
Assign the role on the Data Collection Rule – not on the Data Collection Endpoint and not on the Logic App itself. A role on the wrong resource gives no error, but the HTTP action in Step E fails with 403.
Step E – Add the HTTP action to the workflow
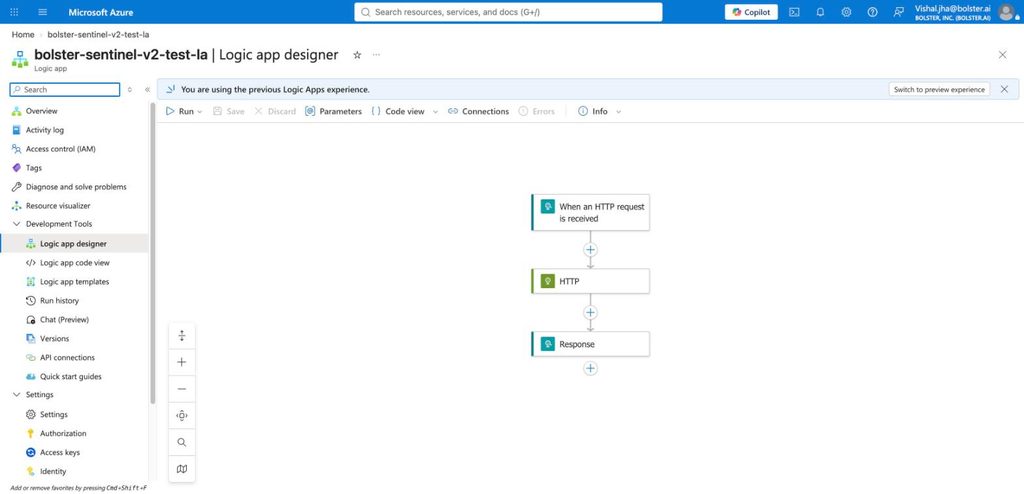
The workflow created above has When an HTTP request is received → Response. Insert an HTTP action between them so the data is sent to Sentinel before the response is returned.
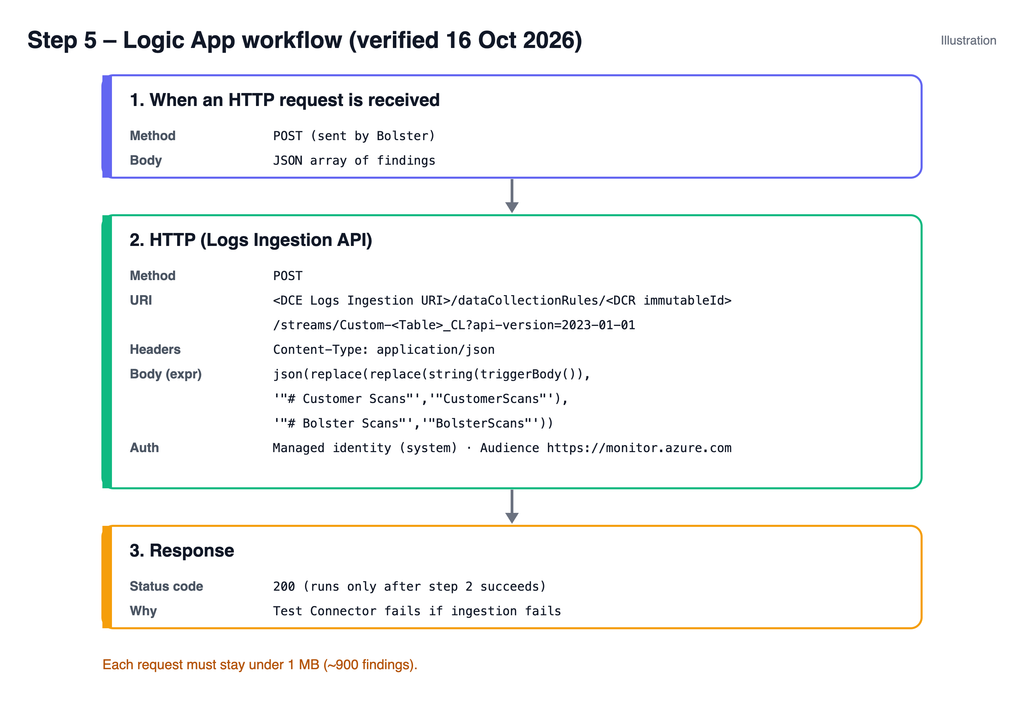
- Open Logic app designer. Set the trigger Method to POST.
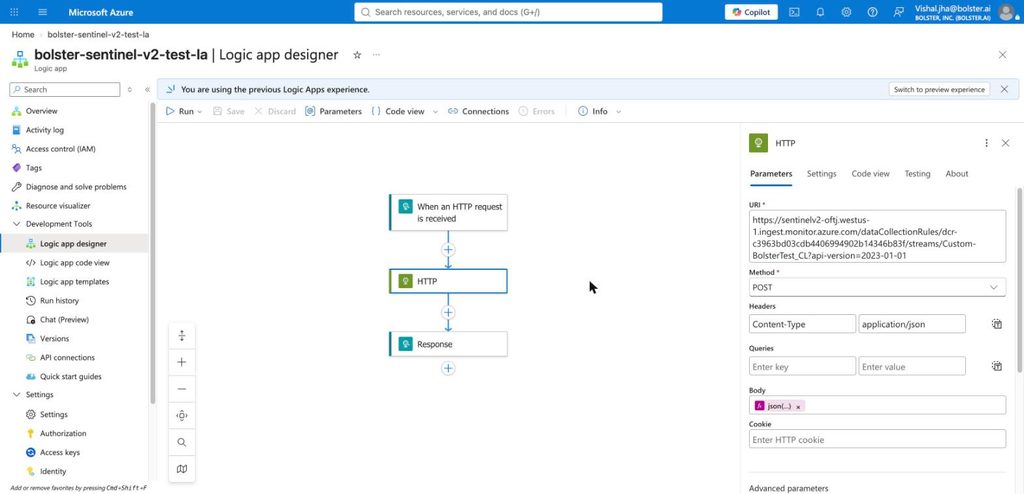
- Click the + between the trigger and Response > Add an action > HTTP, and fill in:
| Field | Value |
| URI | <DCE Logs Ingestion URI>/dataCollectionRules/<dcr-immutableId>/streams/Custom-<TableName>_CL?api-version=2023-01-01 |
| Method | POST |
| Headers | Content-Type = application/json |
| Body | Expression (fx) – see below |
| Authentication (Advanced parameters) | Managed identity · System-assigned managed identity · Audience https://monitor.azure.com |
Body expression (renames the two # fields so they match the table):
json(replace(replace(string(triggerBody()), '"# Customer Scans"', '"CustomerScans"'), '"# Bolster Scans"', '"BolsterScans"'))
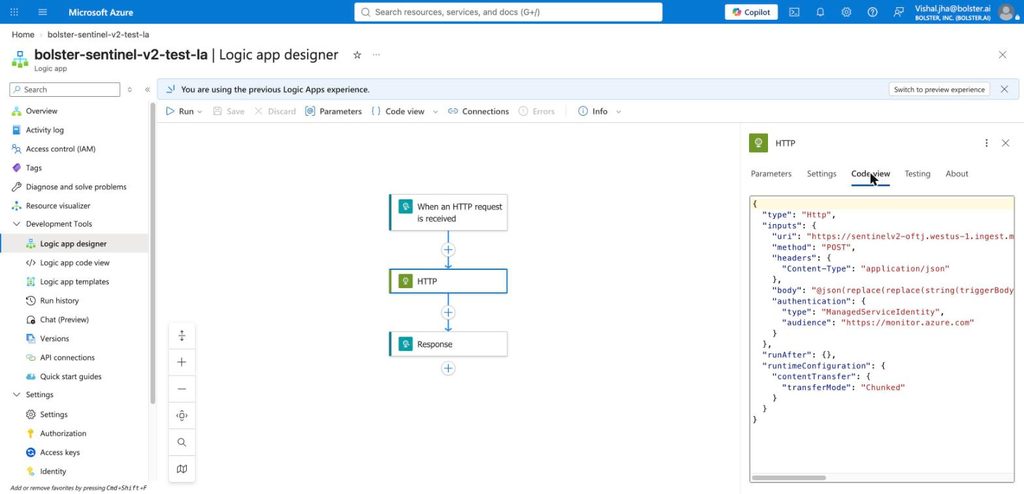
3. Make sure Response (Status code 200) comes after the HTTP action, so Test Connector fails if ingestion fails.
4. Save. The trigger URL does not change, so the Bolster connector needs no update.
Size limit
The Logs Ingestion API accepts at most 1 MB per request (about 900 Bolster findings). Daily playbooks fit; very large exports would fail.
Step F – Verify
- Run a playbook from the Bolster platform.
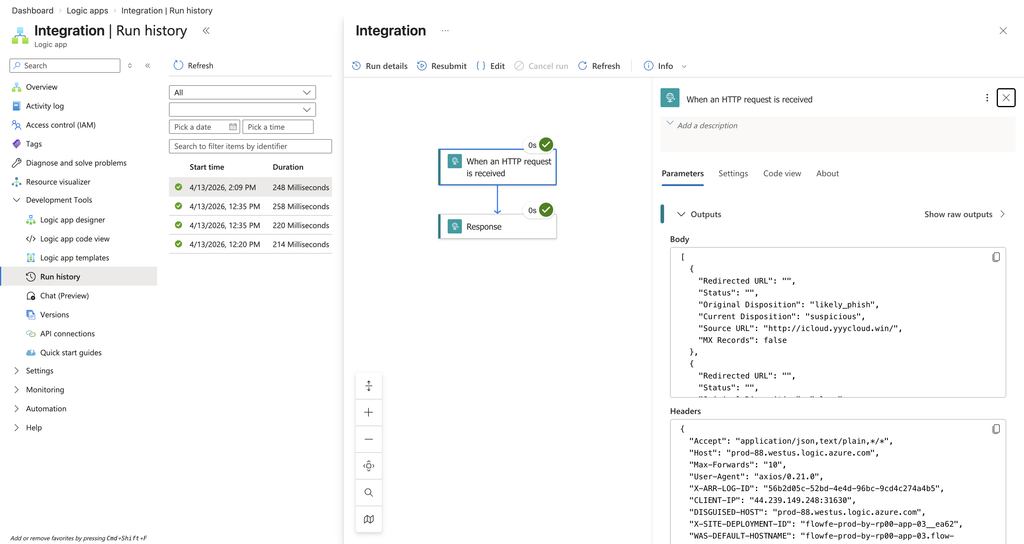
- Logic App > Overview > Run history: the newest run is Succeeded; open it to see all three steps green (the HTTP step returns 204).
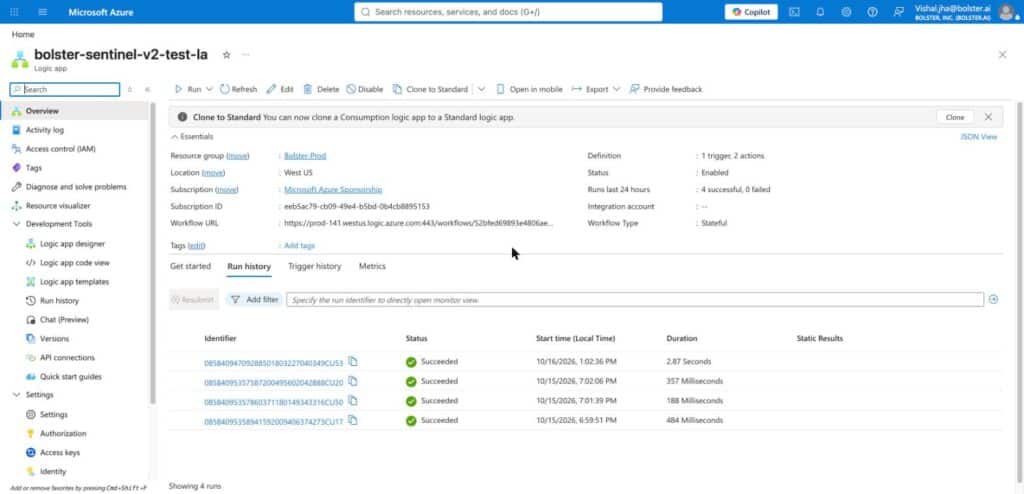 Run history – successful runs
- Workspace > Logs > switch from Simple mode to KQL mode and run the query below. The first data in a new table can take 15–30 minutes.
BolsterFindings_CL
| sort by TimeGenerated desc
| take 20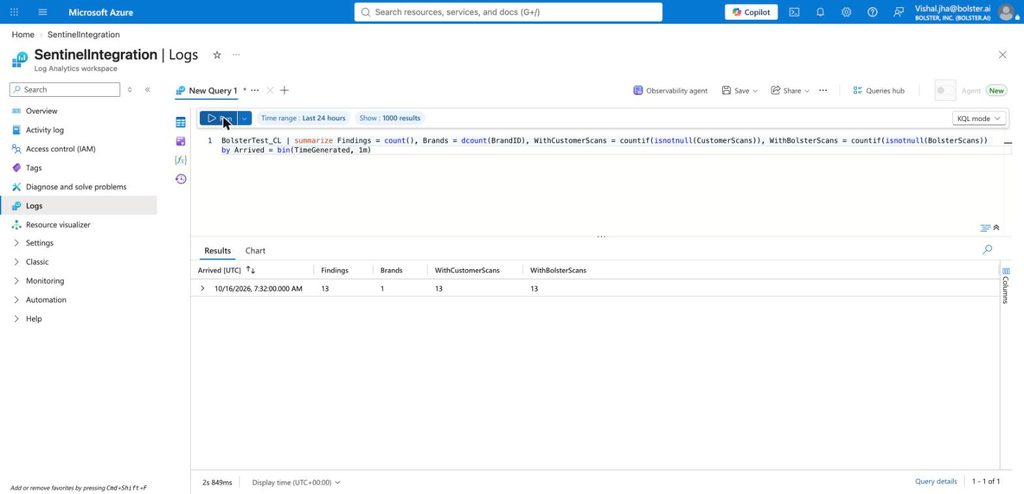 Test result: 13 findings arrived; CustomerScans and BolsterScans populated for all
Troubleshooting
| Symptom | Cause / fix |
| HTTP step 403 Forbidden | Role missing or not yet applied – check Step D (role on the rule), wait 10 minutes, rerun. |
| HTTP step 404 | Wrong URI – check the dcr- Immutable ID and stream name. A dce- ID will not work. |
| HTTP step 400 | Payload does not match the stream – check the body expression and table columns. |
| Runs succeed but table is empty | Wait 15–30 minutes after creating the rule; then check ingestion errors with _LogOperation | where Category == "Ingestion". |
| Table creation fails: "# Customer Scans is not a valid column name" | The sample file still contains the # fields – use the sample above. |